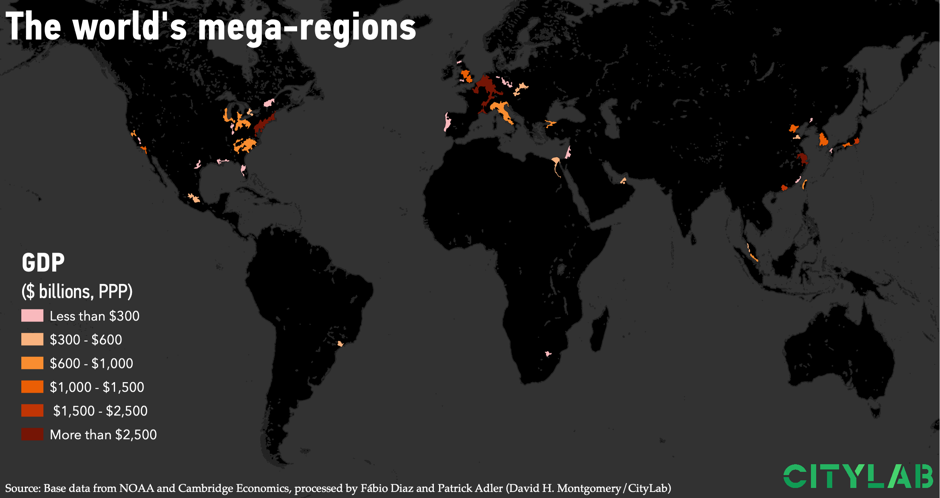
When world leaders, economists, and pundits talk about global economic power, they usually talk about nation-states. That’s how we typically tally up economic power, rating and ranking nations on their gross domestic product. Today, economists and business analysts talk about when China will overtake the United States as world’s largest economy (based on at least one measure of purchasing power parity it already has).
But this obsession with nation-states does not fit the reality of today’s highly-clustered knowledge economy, centered in and around global cities. And, it’s not just individual cities and metropolitan areas that power the world economy. Increasingly, the real driving force is larger combinations of cities and metro areas called mega-regions.
Back in 1961, the economic geographer Jean Gottmann coined the term “megalopolis” to describe the emerging economic hub that stretched from Boston to Washington, D.C. The term came to be applied to a number of regions in the world, including the vast Midwestern megalopolis that extends from Chicago, through Detroit and Cleveland, and south to Pittsburgh, which Gottmann dubbed “Chi-Pitts.”
But mega-regions are hard to identify using traditional data sources. About a decade and a half ago it dawned on me that you can actually see mega-regions like the Boston-New York-Washington corridor when you pass over them in a plane at night. So my colleagues and I undertook a project to identify the world’s mega-regions from these satellite images of the world at night.
But now, much improved night-light data has become available from satellites—data that gives us a better look at the world’s mega-regions. My colleague Fabio Dias, a computer imaging expert in the University of Toronto’s School of Cities, extracted the improved light data from these new satellites, which we analyzed with our colleague Patrick Adler. The new data, referred to as Visible Infrared Imaging Radiometer Suite (VIIRS) and developed by the National Oceanic and Atmospheric Administration (or NOAA), are a huge advancement compared to older satellite images.
Using this new and improved satellite data from 2015, we define mega-regions as areas of continuous light that contain at least two existing metro areas, have populations of five million or more, and generate economic output of more than $300 billion. (We add up population and economic output data on a purchasing power parity basis for mega-regions using base data from Oxford Economics via Brookings’ Global Metro Monitor). In two well-known U.S. cases, we form mega-regions out of two relatively distinct satellite footprints: Chi-Pitts, as well as the Texas Triangle of Houston, Dallas, and Austin.
We ultimately identify 29 mega-regions as the real regional powerhouses of the global economy. Eleven are in Asia, 10 are in North America, six are in Europe, one is in Latin America, one is in Africa, and one more straddles Asia and Africa. My CityLab colleague David Montgomery made the maps of these mega-regions.
Avots: citylab