Residents across the country sometimes see Google Street Cars driving down their blocks. In California, these vehicles are gathering air quality data block by block, which could ultimately help shape local policy to benefit people’s health.
Google released video footage Tuesday showing how the Golden State is doing when it comes to nitrogen dioxide, a gas released in tailpipe emissions and from factories that creates smog and can fuck up your lungs. The data, which focuses on San Francisco, Los Angeles, and the Central Valley, shows how pollution clusters onto certain blocks, meaning the exact street you live on can have a major impact on the quality of air you’re breathing.
Google is hoping this information will help scientists work with policymakers to improve air quality overall.
The project was launched in 2015, in partnership with environmental intelligence company Aclima. With 100,000 miles driven, more than 1 billion data points collected, and a cocktail of pollutants measured, Google might be onto something with it. California, while championed for its progressive environmental policies, is home to the nation’s most polluted cities—all of which are predominantly Latino, and seated in the Central Valley.
Research is showing that pollution can vary on a fine scale, especially within cities as large as Los Angeles. A study published in the journal Environmental Science & Technology in June (with the help of Google Street Cars) shows that air pollution in Oakland concentrates in small “hotspots” throughout the city. Nitrogen dioxide levels are especially high right in front of a metals recycling facility where trucks and heavy equipment frequent, for example.
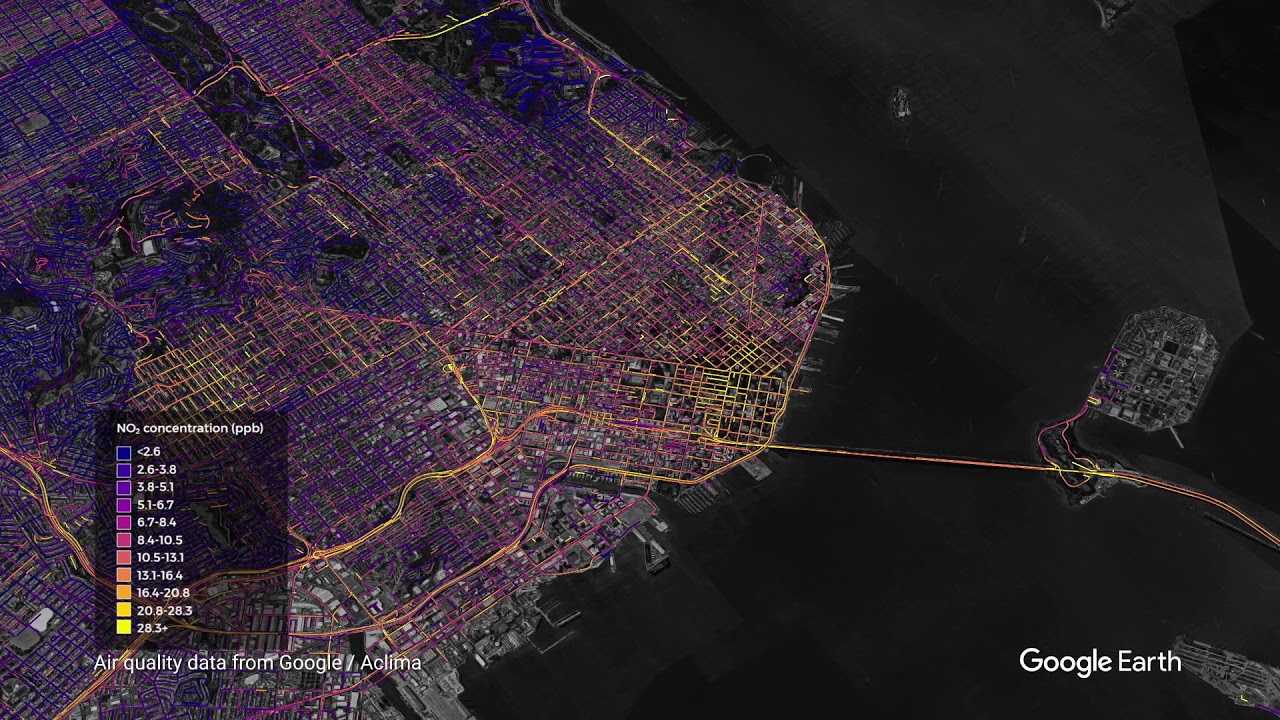
Google isn’t sharing too many details on its data yet, but these new mapping videos provide a sneak peek into how air pollution is distributed throughout cities in the state. The blue shows low nitrogen dioxide levels; the yellow shows high levels. The teams also gathered information on nitric oxide, ozone, black carbon, particulate matter, and methane—all of which are bad news.
This city used to be known for its smoggy skies and dangerous air. Things aren’t as bad today, but they’re also not as good as they should be. Google Street Cars drove through the city for just three months in 2016, so the data isn’t as comprehensive as, say, San Francisco’s, but Google focused on just a few neighborhoods: Boyle Heights, Wilmington, West Los Angeles, North Long Beach, and Westchester.
Boyle Heights and Wilmington are state-designated environmental justice communities for being largely Latino and low-income compared to the rest of the county. The research is showing already-clear pollution patterns related to traffic and congestion in Los Angeles. On a broader scale, weather patterns blow the pollution inland, away from coastal residential neighborhoods like West Los Angeles.
Researchers added to their Oakland 2015 data, mentioned above, by collecting more data between 2016 and 2017. This time, they looked not only at Oakland but also at San Francisco and San Jose. Vehicles and refineries and power plants are mostly to blame for the city’s pollution. It’s no coincidence that power plants exist where the map shines yellow along San Francisco’s eastern coast and Oakland’s western coast.
Home to some of the nation’s most air-polluted cities, the Central Valley’s got a problem. The region is way more rural than its northern neighbors, but it’s also home to some major polluters, especially from agriculture. The topography allows for these pollutants to get stuck in the valley, which doesn’t help the situation.
Google took its first look at how polluted the valley’s air was in 2016 and 2017, with a focus on the cities of Tracy, Stockton, Manteca, Merced, Modesto, and Turlock. In a second round, of data collection, scientists looked only at Modesto, a city of more than 200,000 residents that sees poverty rates above the national average.
The Google team is just beginning to analyze its data on California’s air quality, and it’s opening the door for scientists who want to access the data. All they’ve got to do is request it.
Avots: Earther